As a scientist, I am constantly challenged by the fast progress of my research area. What are relevant papers I shall read? What are the authors’ key topics on a conference and how are papers distributed among them? In this blog post, I demonstrate how to use NLP to derive answers automatically for such questions from publications.
Note, this is not an automated literature analysis. However, some techniques may be used for it.
Directly go to the R notebook with the full analysis: IWSSSAnalysis.ipynb
Motivational Example
Smart sensing system is an active research field involving expertise from many areas ranging from sensor processing at one end to applications on the other end. In June 2019 I took part in the International Workshop on Smart Sensing Systems (IWSSS). The workshop is a forum for exchange of experience among researchers from industry and academia actively involved in research, development and evaluation of smart sensing systems. IWSSS undergoes a constant change of topics discussed throughout the last years. The group of authors changes just as well IWSSS may be the entry door for junior researchers to enter the field and to get involved with the scientific community investigating smart sensing systems.
Objectives and Research Questions
We believe, it is valueable to review the developments of the last years. The objectives are
- Make IWSSS content transparent across years
- Provide an repeatable approach to follow-up on future IWSSS occasions
Some typical research questions are:
- How to explore the papers’ context to achieve a general understanding?
- What are strong relations connecting all documents with each other?
- What are relevant papers to read?
- What are topics and how do papers correspond to these topics?
- Topic evolution: How much are past topics still present in IWSSS?
Approach
This analysis only utilizes titles and abstracts of paper publications. There are valid reasons to focus on these both inputs. First, titles and abstracts are available even when the paper is behind a paywall, second, they often come in formats easy to scrape and parse, e.g. from a website. PDF file content may get very hard to parse automatically, because of tables, formulas and images.
Using papers’ titles and abstracts only, we are able to create a complete as possible data base for our analysis. We store the data in the MS Excel format to enable a convenient way to edit this data base manually.
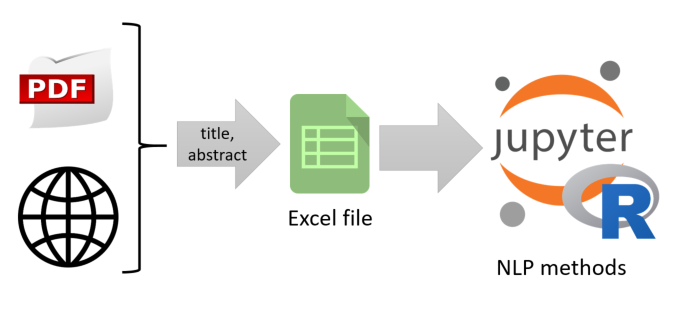
We apply qualitative and quantitative methods from NLP. A paper abstract or title refers to a document in NLP. The pile of papers form a document corpus. The analysis uses the R language.
NLP Methods
The analysis employs the following NLP methods which provide several quantitative measures for the explorative analysis and the modeling of the document corpus.
| analysis class | methods |
|---|---|
| descriptive statistics | papers per year, avg. title length per year, avg. abstract length per year |
| explorative analysis | wordclouds, top-N words, bigrams and trigrams |
| networks analysis | pairwise word count network, pairwise correlation of selected frequent words, pairwise word correlation network |
| modeling | tf-idf statistic, LDA topic modeling, per-topic-per-word probabilities, per-document-per-topic probabilities |
If you like to reproduce these methods using another corpus, we provide a NLP Paper Analysis repository containing the R notebook, the data file and a docker compose file. It enables you to quickstart into the area.
Selected Results
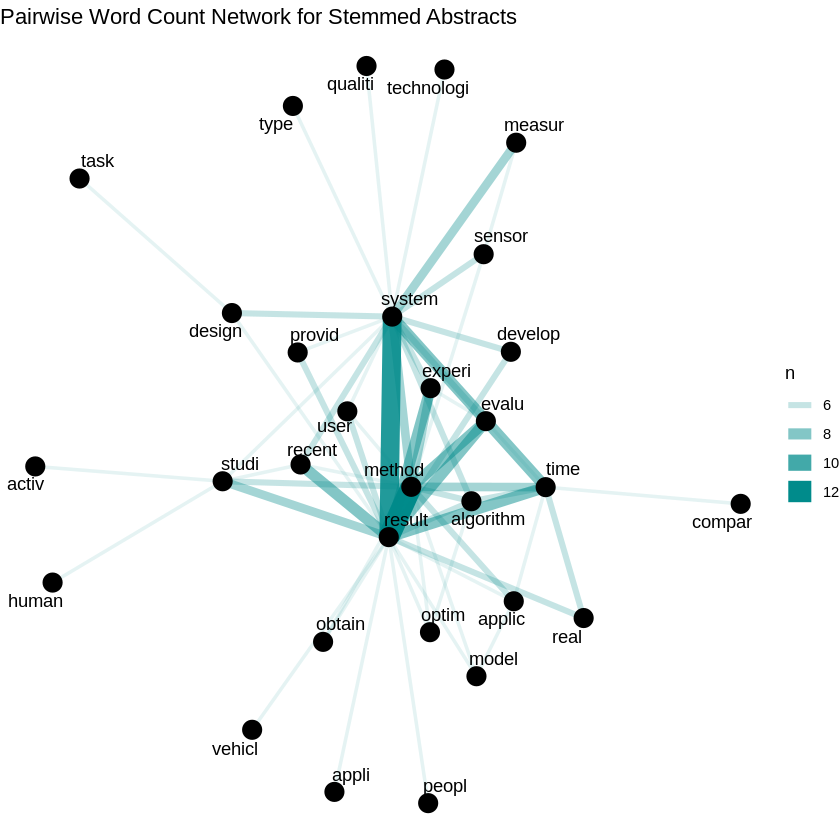
We present some selected results from the NLP methods. For the full analysis please look in the R notebook. Let us start with some visualization. The following figure shows the word count network from stemmed abstracts. The stronger the line, the more often we find these (stemmed) words together.
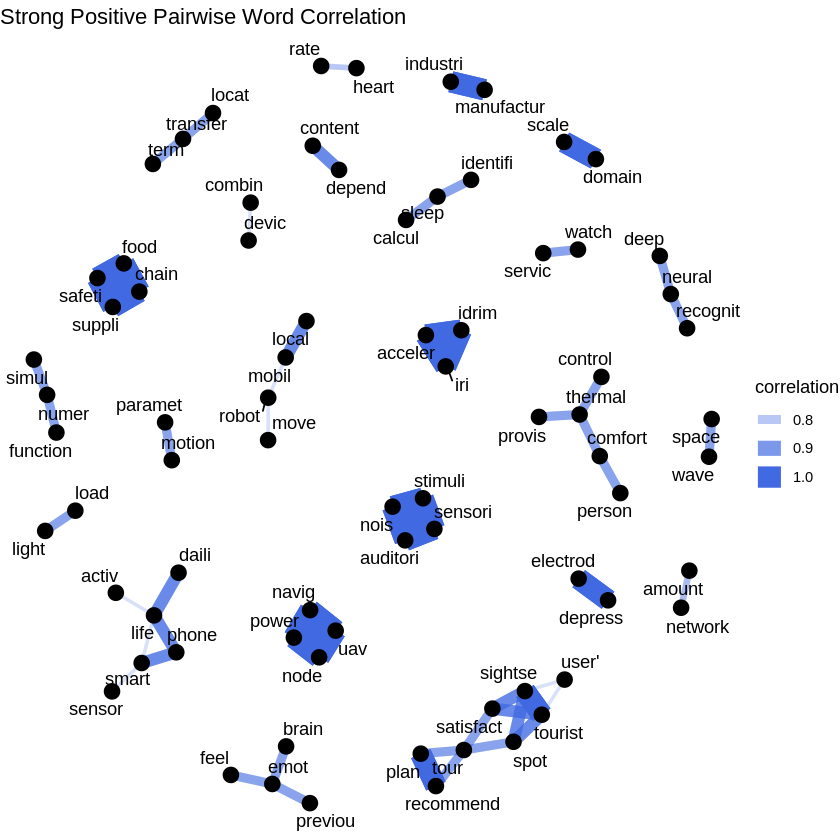
We can extend this approach and the plot the pairwise word correlation. This is basically the pearson correlation coefficient for words. When filtered for correlation coefficients above a threshold, the network reveals some interesting topic islands.
In the following we use tf-idf statistics to compile a paper reading list. The table displays the top-3 papers from this list.
| title | important_words | median_tfidf |
|---|---|---|
| Food Supply Chain Management System for Product History Using Blockchain | learn | 0.3915486 |
| System for motivating ethical consumption behavior using dongle interface application | ethic | 0.3433987 |
| Preference-Aware Video Summarization for Virtual Tour Experience | video | 0.3361408 |
We apply LDA topic modeling and show the distribution of per-document-per-topic probabilities $\gamma$ across the workshop years. The plot below shows boxplots for each topic and year. It marks the mean of $\gamma$ as a blue point and the max of $\gamma$ as a red triangle.
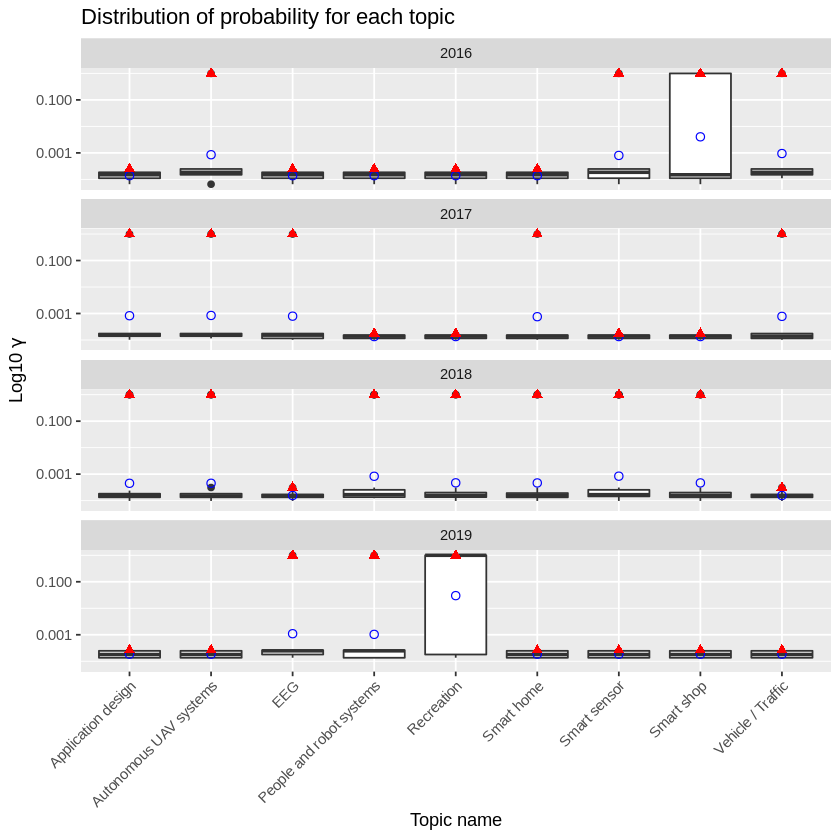
Finally, let’s list the papers from those topics which have dominated the workshops in 2016 and 2019.
| year | topic name | title |
|---|---|---|
| 2016 | Smart Shop | Damage Detector: The Damage Automatic Detection of Compartment Lines Using A Public Vehicle and A Camera |
| 2016 | Smart Shop | Detecting Moving Objects Using Optical Flow with a Moving Stereo Camera |
It is imaginable from the titles that this classification is reasonable. However, this notebook just provides hints.
Take it with a Grain of Salt
Not all classifications are correct. It still requires a user to justify the recommendations. The table shows the papers from the topic “Recreation”.
| year | topic name | title |
|---|---|---|
| 2019 | Recreation | A Method for Generating Multiple Tour Routes Balancing User Satisfaction and Resource Consumption |
| 2019 | Recreation | An Approach for Measuring IoT Interoperability using Causal Modeling |
The notebook’s author also coauthored the paper “An Approach for Measuring IoT Interoperability using Causal Modeling”. It is unclear why the model has classified this paper into the Recreation topic. It definitely does not fit there.
So, always take an automatic analysis with a grain of salt.
Resources
- Repository on NLP Paper Analysis for reproducing this analysis
- R notebook with the full analysis: IWSSSAnalysis.ipynb